Quantitative Business Data Analysis Using SPSS is the statistics course in Walden's DBA sequence, and the B version of the code carries 4 semester credits. Descriptive statistics, statistical inference, t tests, analysis of variance, correlation, multiple linear regression, discriminant analysis and nonparametric methods such as two-way contingency table analysis all arrive here, run through SPSS. Discriminant analysis is the piece the catalog lists for the B version and not for the shorter one. One thing to check on day one: Walden's catalog lists both DDBA 8307 at 3 semester credits and DDBA 8307B at 4, under the same title, so confirm in your portal which one your program registered you for.
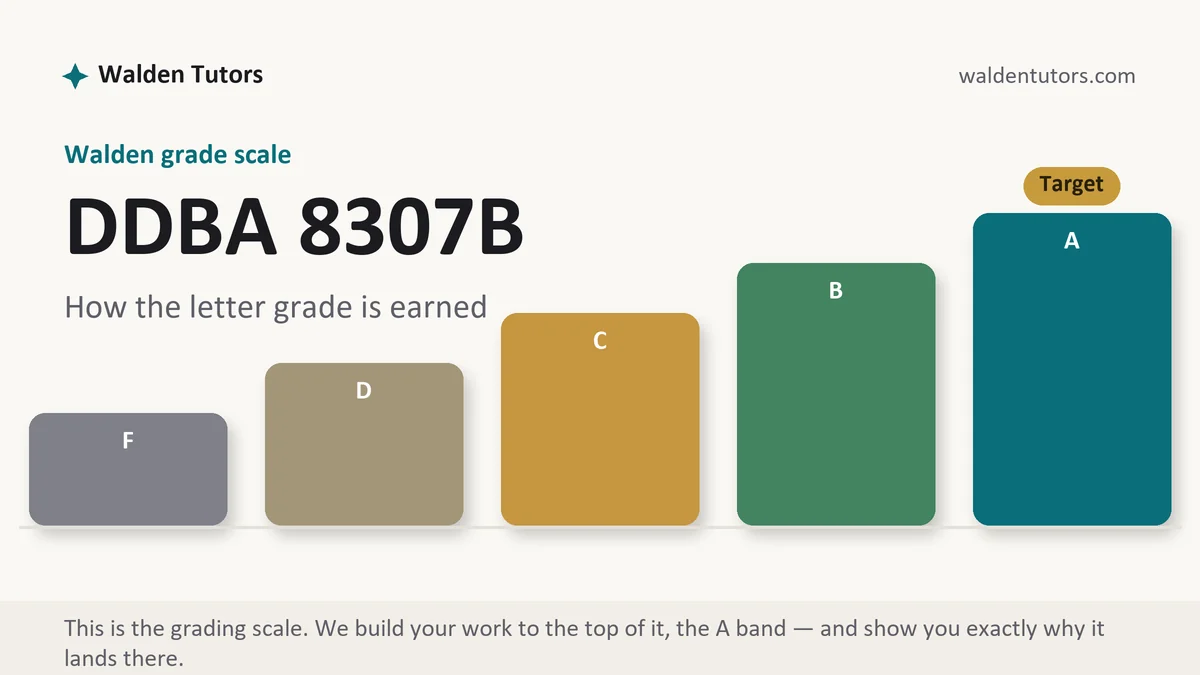
What DDBA 8307B actually grades
Not arithmetic. The software does the arithmetic, and it will do it just as obediently on a variable that should never have been entered. What the rows examine is whether you picked the right procedure for the question, whether you checked the conditions that procedure depends on, whether you read the output correctly, and whether you can say what the number means for a business without overstating it.
Expect assignments that hand you a dataset and a question, ask you to run something, then ask you to write up the result in APA form and interpret it for a manager. Discussion threads tend to run parallel, arguing about which test suits which scenario. The pattern in the marks is consistent: students who came from a numbers-heavy job often lose points on the writing rows, and students who write beautifully lose them by describing an output they misread. The paper has to do both.
How we help in this course
Send the dataset, the prompt and the scoring guide, and you get back a written analysis with the reasoning visible: why that test, what the assumption checks showed, what the output says, and what a decision maker should take from it. The tables come formatted the way APA 7 wants them rather than pasted out of the viewer, and the delivery note points at the row each part answers.
The usual promise applies here too. Original work inside 24 to 48 hours, aimed at the top band of a course-based rubric, reviewed independently twice before it reaches you, revised at no charge until it does what you needed. Statistics drafts also come with the interpretation written in plain sentences, because the row that asks you to translate a coefficient into a business implication is the one most often left thin.
Weekly manuals for this course
Week manuals for this course go live one at a time, after verification, and we will not print a deliverable grid we cannot stand behind. Walden keeps the syllabus inside the classroom, so any confident week-by-week table for a DBA statistics course found on the open web was assembled from guesswork.
Term length runs on the semester calendar here, because DDBA numbers belong to the semester build and the quarter build of this doctorate is numbered DBAX, and the student portal is the place that will tell you truthfully how long your own session lasts. Whichever it is, work posts before 10:59 p.m. Central, which reads as 11:59 p.m. on an Eastern clock. No manual yet for the week you are in? Open chat with the prompt attached and we will size it the same day.
SPSS assignment due and the output makes no sense?
Send the dataset with the prompt and rubric. Your first premium analysis is free and comes back in under two days.
How to actually write DDBA 8307B: rubric rows first, output second
The temptation in a statistics course is to open the data file immediately. Resist it for twenty minutes. Pull the scoring guide up, write each row as a heading in a blank document, and put the marks it carries in brackets beside it. What you get is a skeleton of the finished paper before any analysis exists, and in this course there is one comparison worth making before anything else: set what the interpretation and business-implication rows are carrying against what the rows for running the test are carrying. Nearly everyone assumes the software work is where the marks live, and only the guide in front of you can confirm or refute that. Students who budget by effort rather than by marks spend their evening in SPSS and their last ten minutes on the section that pays most.
With the outline standing, write the question and the hypotheses in words before you touch a menu. State the null and the alternative as full sentences, name your alpha level, and identify each variable with its measurement level, because scale, ordinal and nominal determine which procedures are even available. That paragraph is the one place where an error is cheap to fix. Discover halfway through a regression that your outcome variable is categorical and you have lost an evening; notice it here and you have lost a line.
Then match the procedure to the question deliberately, and write down why. Comparing two independent groups on a continuous outcome points at an independent samples t test. Comparing three or more groups points at analysis of variance, with a post hoc procedure to say which pairs differ. Asking whether two continuous measures move together points at correlation, and asking how much of one is explained by several others points at multiple linear regression. Where the data will not meet the conditions those tests assume, the nonparametric equivalents exist for exactly that reason. One sentence of justification in the paper earns a row that many submissions leave empty.
Check assumptions before you report anything, and put the check in the write-up rather than in your head. Normality, homogeneity of variance, linearity, independence of observations and, for regression, multicollinearity all have diagnostics you can run and report in two lines each. Reporting a violation and dealing with it is not a confession, it is the behavior of a competent analyst, and the rows treat it that way. What costs marks is silence: a paper that presents a clean result from data that plainly breached a condition invites the reader to distrust everything else in it.
Write the results section in APA 7 and keep the interpretation out of it. Report the statistic, its degrees of freedom, the value, the exact p to three decimals where the software gives it, and an effect size wherever your assignment asks for one, then let the discussion section explain what it means. Build the tables yourself instead of screenshotting the output viewer: an APA table carries only the numbers a reader needs, with the title above it and the notes below. Then translate. A regression coefficient in a business paper should be readable as a sentence about the firm, saying that each additional unit of one thing is associated with a stated change in another, holding the rest constant, and it should be followed by the caution that association is not causation. Pull your methodological sources through the Walden Library, cite the authors whose rules you are applying in the sentence where you apply them, and let the Writing Center check your formatting once early rather than after a grade comes back.
| Section | What it does | Common failure |
|---|---|---|
| Question and hypotheses | States the business question, the null, the alternative and the alpha level in plain sentences. | Hypotheses written after the analysis so they agree with whatever the output produced. |
| Variables and measurement | Names each variable, its role, and whether it is scale, ordinal or nominal. | A categorical variable treated as continuous, which quietly invalidates the whole procedure. |
| Assumption checks | Reports the diagnostics the chosen test depends on and what they showed. | Assumptions listed in the abstract and never actually tested against this dataset. |
| Procedure and justification | Says which test was run and why it fits the question and the data. | A test named with no argument, as though the choice were obvious to everyone. |
| Results in APA form | Gives the statistic, degrees of freedom, p value, effect size and a table you built. | Pasted output windows standing in for a results section, with no numbers written into sentences. |
| Business interpretation | Turns the finding into a statement a manager could act on, with its limits attached. | Significance reported as proof of cause, or a coefficient left untranslated into anything practical. |
Threads where exactness beats eloquence
Threads in a statistics course reward exactness over eloquence. If you claim a scenario calls for analysis of variance rather than a series of t tests, say why in one line about inflated error across multiple comparisons, cite the source you are relying on, and give the business example that makes it concrete. Two tight paragraphs like that beat a page of general enthusiasm for evidence-based decisions.
Walden's grading policy expects posts that are substantive, consistent and delivered on time, and it steers you toward contributions landing on two to four different days at least, instead of one burst before the deadline. Walden also notes that these requirements are not uniform, varying between courses and between weeks, so the week's own instructions are the authority. Replying well in this course usually means catching something technical and saying so kindly: the measurement level that will not support the test they proposed, the assumption nobody checked, the causal verb sitting on top of a correlational design. Bring the correction and the reason together, and the row is earned.
The mistakes that cost points in DDBA 8307B
- Running the procedure first and writing the hypotheses afterwards so they match the answer.
- Ignoring measurement level, then applying a test the variable cannot support.
- Skipping assumption diagnostics, or running them and never mentioning what they showed.
- Dropping screenshots of the output viewer into the body instead of building an APA table.
- Reading a significant p value as proof that one variable caused the other.
- Reporting p as .000, when it should be given as less than .001.
- Stopping at the statistic and leaving the reader to work out what a business should do about it.
DDBA 8307B questions students actually ask
Do I have to paste the raw SPSS output into the paper?
Read your assignment, because practice differs by week. Where output is requested, it usually belongs in an appendix rather than in the middle of your argument, and the body of the paper carries an APA-formatted table you built yourself with only the numbers a reader needs. Screenshots of the whole viewer window pasted into the results section are the giveaway that the software ran but the analysis was never written. When in doubt, present a clean table in the body, keep the full output in an appendix, and refer to it once.
What do I do when an assumption test fails?
You report it and then you respond to it, which is worth more marks than a clean dataset would have been. Say which assumption failed, show the evidence, and choose a defensible next step: a transformation, a correction that does not assume equal variances, a nonparametric equivalent, or the original test with the violation stated as a limit on your conclusion. Every one of those is acceptable if you argue for it. The version that loses points is the one where a normality test comes back badly and the paper carries on as though it had not.
My result was not significant. Did I do the assignment wrong?
Almost certainly not. The rows are scoring your procedure and your reading of the output, not the direction the data happened to fall. A non-significant finding is a finding: it says the evidence here does not support rejecting the null, which is a different statement from proving there is no effect, and confusing those two is a real error where the result itself is not. Report the statistic, state what you can and cannot conclude, and mention sample size honestly, since a small sample may simply lack the power to detect a difference that exists.