NURS 8310 help and tutoring

NURS 8310 · 5 credits · DNP core
The short answer

Epidemiology and Population Health carries the code NURS 8310 at Walden and is worth five credits in the DNP core. It moves your attention off the individual patient and onto the group, and the writing it grades asks you to argue about whole populations using numbers other people collected.

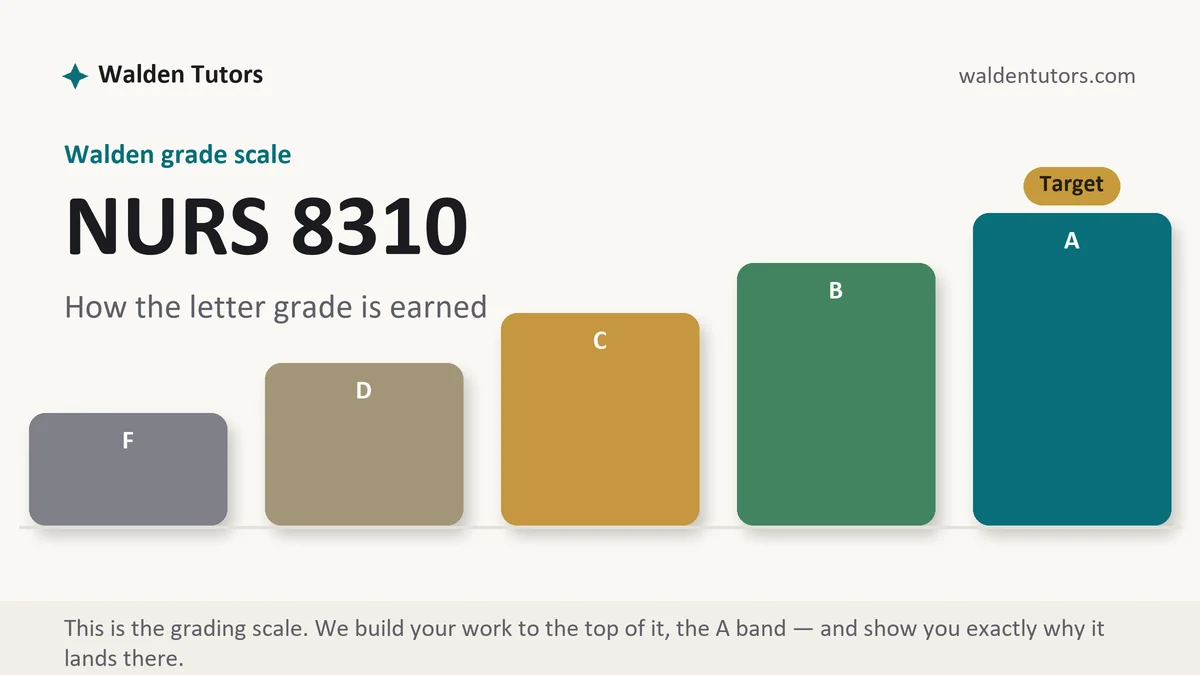
NURS 8310 grading scale at Walden, how the work is graded, from Walden Tutors
How Walden grades NURS 8310, visualized by Walden Tutors.

What NURS 8310 actually grades

The published description marks out the territory clearly. You work through epidemiologic method as it applies to the distribution and cause of disease in human populations, look at chronic and infectious conditions along with the health effects of disasters and emergencies, and study the designs epidemiologists use, their data sources, their measures, the errors that creep into each, and the ethics of gathering any of it. Walden also states that students in this course develop a program proposal aimed at a population health concern using those methods, which tells you where the term is heading long before you get there.

Written work in a course built that way is graded on a shift in perspective more than on recall. Clinical writing describes one person; population writing describes a rate, and a rate is a claim about a numerator and a denominator that both need defending. Rows tend to reward four things: choosing a health problem that the data can actually support, describing its distribution with real figures rather than adjectives, reasoning about cause with the appropriate caution, and proposing something a health department could conceivably run.

The second thing graders look for is restraint about causation. Observational designs are the backbone of this field and almost none of them establish cause on their own. A paper that says an exposure is associated with an outcome, then explains what would have to be true for the association to be causal, scores better than one that leaps. Language matters here in a way it rarely does elsewhere: associated with, more likely among, and concentrated in are defensible, while causes, leads to and results in usually are not.

How we help in this course

We write 8310 deliverables with the numbers sourced and the causal language kept honest. Send the prompt and the scoring guide, tell us the population you have picked or ask us to suggest one that has published data behind it, and the draft comes back with each figure attributed to a named surveillance source, the measures used correctly, and the limits of the design stated where they belong.

Standard terms apply. Work returns within 24 to 48 hours, every rubric row is drafted toward the top band, two reviewers check it independently, and revision stays free until the target is reached.

Weekly manuals for this course

Nothing week-specific for NURS 8310 is published on this site yet. Manuals appear one at a time and only after their contents can be checked against something Walden itself puts in writing. Bring your week to chat in the meantime; the drafting side of the desk is already open and does not depend on the manual existing.

A scheduling note worth having. Walden's quarter calendar publishes a full term of eleven to twelve weeks, and a shorter six-week half term also sits inside the quarter. Because of that, the count of graded items you owe is a property of your section rather than of the course code, so read your own syllabus before you plan around anything.

In NURS 8310 right now?

Upload the prompt and the scoring guide from your classroom. Your first premium sample is free and comes back in a day or two.

Rates, ratios and the arithmetic a grader checks

Almost every point lost on the quantitative rows in this course traces back to one of four small confusions, and all four are fixable in an afternoon. Prevalence against incidence is the first: prevalence counts everyone living with a condition at a moment, incidence counts only the new cases appearing across a stated interval, and a paper that treats them as synonyms has already misdescribed its problem. The second is the denominator. Cases over the whole population and cases over the population genuinely at risk are different numbers, and screening or vaccination arguments turn on which one you used.

Third is adjustment. Two counties can post very different crude mortality rates purely because one of them is older, so an age-adjusted figure is the one that permits a comparison, and saying why you chose the adjusted number is itself worth a sentence. Fourth is the measure of association. Relative risk and odds ratio answer slightly different questions and belong to different designs, and attributable risk speaks to how much of a burden would lift if the exposure went away, which is usually the figure a program proposal actually needs. Print units and time frames beside every number. An unlabelled figure reads as guesswork even when it is right.

How to actually write NURS 8310: write the case definition before anything else

The first thing on your page should be a case definition, and writing it early is the single habit that separates a clean epidemiology paper from a muddled one. A case definition fixes three things: who counts as a case, where they have to be, and during what stretch of time. Every number you print afterwards inherits those boundaries, which is why a definition written loosely at the start produces figures later that quietly refer to different populations. Write it as one sentence you could hand to a health department analyst and expect the same count back. If you cannot make that sentence concrete, the problem is not your writing; it is that you have not yet decided what you are studying.

Decide which measure your argument actually needs before you go looking for data, because the measure dictates what evidence will satisfy the reader. An argument about screening burden wants prevalence. An argument about a rising threat or the effect of a new exposure wants incidence. An argument that a risk factor matters wants a measure of association, and an argument about how much benefit a program could deliver wants attributable risk. Picking the measure first turns an open-ended search into a specific errand, and it stops the common inversion where a student finds an impressive-looking figure and then bends the argument to accommodate it.

Now pick the health problem, and pick it by testing the data first. Before you commit to a topic, find one real figure for it in your chosen population, from a source you can cite, with a year and a denominator attached. If that figure is easy to find, the whole paper will be easier. If it is suppressed, unavailable at your geography, or exists only in a news article, change the topic or widen the population now rather than discovering the hole in your significance section at the very end.

Build the paper outward from the distribution. Describe who is affected, where, and when, using person, place and time as the organizing frame, then move to why, then to what could be done, then to how you would know whether it worked. That order mirrors how the field itself reasons, and it keeps the proposal tethered to the evidence rather than floating free of it. When you reach the intervention, choose one whose effect has been reported somewhere so you can cite an expected magnitude, because a proposal that promises improvement without a source is a wish rather than a plan.

Where the assignment calls for synthesis across studies, remember that in this field the studies rarely agree neatly, and saying so is a strength. A synthesis paragraph that names what the body of work supports, then states where it splits and what design differences explain the split, demonstrates exactly the judgment a doctoral row is written to reward. Listing findings one study per sentence demonstrates that you read them, which is a much lower bar.

SectionWhat it doesWhere it goes wrong
Problem and significanceNames the health concern and shows with figures why it matters in this population.Significance argued from national headlines while the population you chose never gets a number of its own.
Population definitionFixes the geography, the group and the time window the rest of the paper will use.A definition so fine that no agency publishes data for it, leaving every later section unsupported.
Descriptive epidemiologyLays out distribution by person, place and time using cited rates.Adjectives standing in for measures, so the reader learns the problem is serious but never how common it is.
Determinants and causal reasoningExamines risk factors and how far the evidence supports a causal reading.Association written up as cause, usually in a single verb nobody noticed choosing.
Data sources and their limitsSays where each figure came from and what that source can and cannot see.Surveillance data used as though it were complete, with no mention of under-reporting or case definitions.
Proposed programSets out the intervention, its level, its target and the evidence behind choosing it.An intervention aimed at individuals when the described problem was structural, or the reverse.
Evaluation planStates the measures, the baseline and the change that would count as success.Outcomes nobody currently collects, which makes the evaluation unrunnable before it starts.

Citations and APA the way Walden grades them

Two kinds of source carry this course and rubrics treat them differently. Peer-reviewed studies establish what is known about a relationship, and they get cited the way they would be anywhere else. Surveillance and agency data establish the size of your problem, and those citations need more with them: the agency, the dataset, the year of the data as distinct from the year of the webpage, the geography, and where the figure sits in the report. Give a reader that and the number becomes checkable, which is what an evidence row is really asking for.

On mechanics, Walden grades APA 7 as a scored element and the Writing Center publishes the templates that grading assumes, so it costs less to copy their formatting than to defend your own. Do your searching inside the Walden Library instead of a general search engine, since that is where the indexed databases sit and where a link will still resolve when a grader clicks it months later. Keep a running reference file from the first deliverable onward, because in a course that builds toward a proposal the same sources reappear repeatedly and a list that drifts will contradict itself by the end.

Discussion posts that earn their row

Threads here usually put a population, an outbreak scenario or a measure in front of you and ask what you would conclude. Treat the initial post as a short analytic note: name the measure or design in play, give the figure with its source, say what it supports, then say what it cannot support and why. Population health arguments are made of numbers, and a post without one is a post about feelings on a topic that has data.

Walden's policy on participation asks that contributions be substantive, regular and on time, and it suggests posting across two to four separate days rather than compressing everything into one sitting. In this course that advice has teeth, because good replies require having read what classmates chose, and nothing is there to read if the whole section arrives at the end. Walden is also explicit that expectations differ from one course to the next and even between items inside a course, so let your own classroom set the count and the deadlines. The nightly cut-off itself is fixed at 10:59 p.m. on the Central clock, one hour later for anyone working in Eastern.

What lifts a reply out of the agreement band is doing epidemiology to it. Ask whether the rate quoted was crude or adjusted and what that changes. Point out that the data source your colleague used undercounts a particular group. Suggest that the association they described could be produced by a confounder they have not mentioned, and name it. Offer a second study from a different setting and say what the difference in setting implies. Courteous, cited disagreement is the shape of scholarly exchange, and a critical-thinking row has nothing to score in a compliment.

The mistakes that cost points in NURS 8310

  • Writing about a population the published data cannot describe, which starves every later section of figures.
  • Reporting a rate with no denominator, no year and no geography, so the number cannot be checked or compared.
  • Treating an association from an observational design as settled cause, most often through an unguarded verb.
  • Ignoring confounding entirely, then proposing an intervention aimed at the variable that was confounded.
  • Proposing an individual-level behavior change program for a problem the paper itself described as structural.
  • An evaluation plan built on measures the local health system does not gather, which no reviewer could approve.

NURS 8310 questions students actually ask

Where do I get population data I am actually allowed to cite?

Start with the surveillance systems that publish for exactly this purpose. National and state health departments post disease and behavioral risk data, and most counties publish a community health assessment that already carries the local figures you need. Registries and national survey programs cover chronic conditions and risk factors. Reach those through the Walden Library where you can, because a stable citation matters more than a convenient one, and record the data year, the geography and the denominator with every number you copy. A rate without its denominator and its year is unusable in an epidemiology paper, no matter how impressive it looks.

Do I have to calculate the rates myself?

Sometimes, and the arithmetic is simpler than the anxiety around it. A crude rate is cases over the population at risk, scaled to a round number so the result reads cleanly. Prevalence counts everyone who currently has the condition, incidence counts only the new cases arising over a defined stretch of time, and conflating the two is the error rubrics catch most often. Where your assignment provides an age-adjusted figure, use it and say why adjustment matters for comparing two populations with different age structures. Show the working when the instructions ask for it, and always print the units beside the number.

How narrow should the population in my proposal be?

Narrow enough that published data exists for it and broad enough that the data is not suppressed. Small subgroups look precise on paper and then turn out to have counts too low for any agency to release, which leaves your significance section with nothing to stand on. A workable definition usually fixes three things: a geography that matches how the data is reported, an age band or clinical group, and a time window. Test the definition by trying to find one real figure for it before you commit. If no number exists, widen one dimension and try again.

Keep going

Online now