PUBH 8546 help and tutoring

PUBH 8546 · 5 credits · DrPH
The short answer

This is Walden's five-credit doctoral course in working with data somebody else collected. The catalog puts secondary analysis and health informatics at the center, then adds community health determinants, health services utilization, complex sampling with power calculations, multilevel regression that mixes individual and group-level variables, quantitative surveillance data, and Geographic Information Systems. It sits behind PUBH 8211, so the statistics are assumed and the writing is where most of the grade moves.

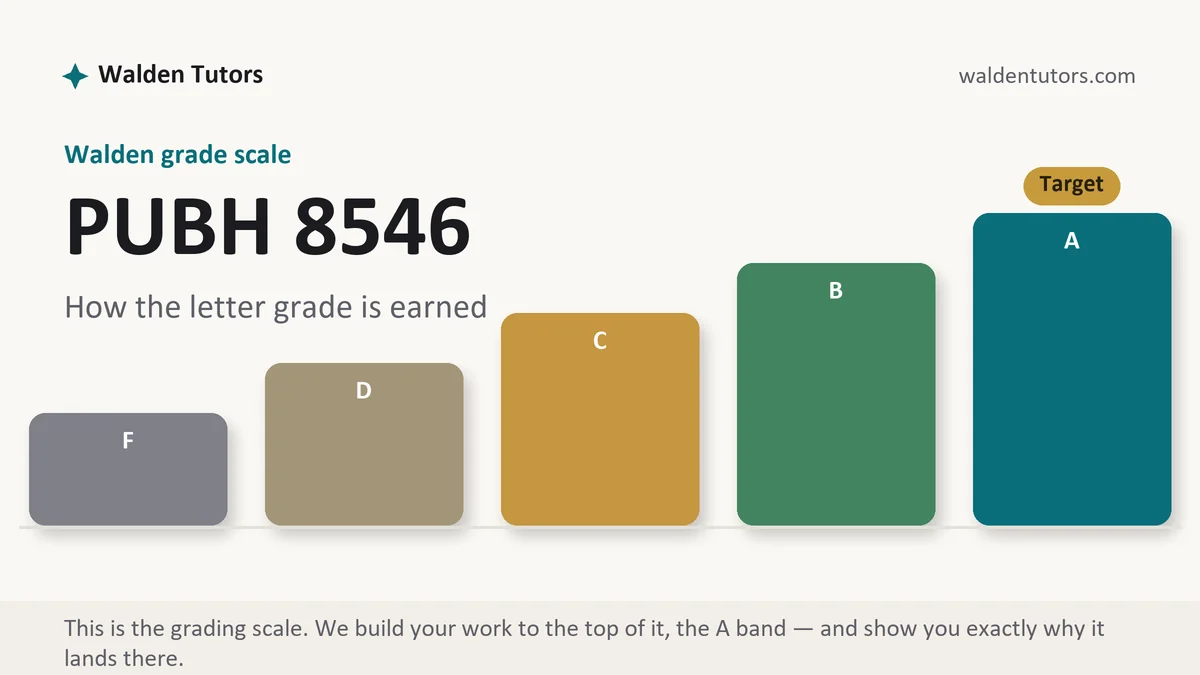
PUBH 8546 grading scale at Walden, how the work is graded, from Walden Tutors
How Walden grades PUBH 8546, visualized by Walden Tutors.

What PUBH 8546 actually grades

Defensible analytic decisions, written down. The work here runs to secondary data analysis papers, dataset appraisals, methods sections, surveillance interpretations, and mapping deliverables, and the rubric rows behind them keep returning to the same demand: say what you did, say why you did it that way, and say what the choice costs you. Running the model is the part students worry about and rarely the part that loses points. Papers slip when a reader cannot tell which sample was actually analyzed, whether the survey design was accounted for, or how missing cases were handled.

How we help in this course

We write the methods section so a stranger could repeat it. That means the dataset named with its year and cycle, the analytic sample built by stated exclusions with the numbers dropped at each step, the outcome and exposure defined by their actual variable coding, the covariates justified rather than listed, and the design elements handled openly. Results get reported in APA tables with estimates and intervals, and interpretation stays out of them until the discussion. Send an earlier paper and the voice carries over.

Our terms hold steady here as everywhere else: delivery within two days of the brief, an A on the rows as the stated aim, a scoring review plus an independent originality and formatting review before anything is released, and free revision until you reach the grade band you asked for.

Weekly manuals for this course

PUBH 8546 week manuals appear as individual deliverables are confirmed, one at a time. Walden holds its syllabi inside the classroom, and a numbered grid guessed from a sibling course would be fiction dressed as guidance, so it does not go on this page. Send the week you are working through to chat and it gets handled whether or not a manual exists. On the calendar: the DrPH is published as a quarter-by-quarter plan of study, which places you in a quarter term. Walden lists dates and leaves you to count the weeks, and a forward span such as Spring 2027, March 1 through May 16, works out to roughly eleven weeks. Half terms of about six weeks also run inside a quarter, so read your section's dates in the student portal rather than assuming them.

Analysis due and the output will not behave?

Send the assignment, the scoring guide, and the dataset you are using. Your first premium sample is on the house, back inside 48 hours.

What a data analysis rubric is really testing

Reproducibility and restraint. Reproducibility means every decision is visible: which cases were kept, which variables were recoded and how, which model was fitted, which software did it. Restraint means the claims stop where the data stops, and this is the row that catches doctoral students most often, because secondary data invites conclusions it cannot support. A cross-sectional survey shows association and nothing else, and a sentence saying that low income leads to delayed care will be marked no matter how plausible it is. Assignments close at 10:59 p.m. Central and 11:59 p.m. Eastern, and the letter assembles from those rows individually, so a careful methods section quietly protects the rows that follow it.

What we need to start a PUBH 8546 draft

The assignment and its scoring guide, the dataset and year you are permitted to use, your research question, and the software your course expects. If you have already run something, send the output file and the syntax rather than screenshots, because the syntax tells us what actually happened. Say whether the assignment requires weighted estimation, a multilevel specification, or a map, and mention any page limit. What returns is a paper with a methods section a reader could follow, formatted tables, an interpretation that respects the design, and notes matching each heading to the row it answers.

Try the desk on one analysis write-up

Spend the free sample on a full secondary analysis paper rather than a discussion post, since that assignment tests everything the course cares about in one document. You will see how the analytic sample is built and reported, whether the design elements are handled, how tables are constructed, and where the line between reporting and interpreting is drawn. Send the instructions with your rubric, read the draft against your own rows, then decide. The seasonal offer takes a cut off your first paid order after that.

How to actually write PUBH 8546: where to begin

Read the scoring guide before you open any data. It sounds backwards in an analysis course and it is the single highest-return habit here, because the rows will tell you whether the grade sits on the model, on the interpretation, or on the presentation, and those three demand different amounts of your time. Copy the rows into a document, make them headings, note the weights, and only then start work. A beautifully specified model in a paper that never justified its covariates will lose more points than a simple model explained well.

Choose the question and the dataset together. Secondary analysis is bounded by what somebody else decided to measure, so the honest sequence is to pick a broad interest, open a codebook, see what is actually in the file, and then sharpen the question until the file can answer it. Confirm the outcome exists as a usable variable, confirm the exposure exists, confirm the covariates you would need for a defensible adjustment are present in the same cycle, and confirm the geography is fine enough for the community-level claim you want to make. Large national surveys rotate their modules, so a measure available in one year can be absent from the next, and discovering that after you have written an introduction is a painful way to learn it.

Then write the methods section as instructions rather than as narrative. Name the survey, the sponsoring agency, the years, and the target population. Describe the sampling design in the terms the documentation uses, including stratification, clustering, and weighting, and say which weight variable you applied and why. This matters practically rather than ceremonially. Complex survey data analyzed as if it were a simple random sample produces standard errors that are too small, confidence intervals that are too narrow, and significance that is not there, and a grader who knows the dataset will spot it in your first table. Build the analytic sample as a visible chain: total records in the file, then each exclusion with its count, then the number analyzed. Say how missing data was treated and be specific, because dropping incomplete cases is a decision with consequences and treating it as housekeeping is what the limitations row is watching for.

Handle the multilevel piece by explaining the structure before the equations. Individuals nested inside counties, tracts, or clinics are not independent observations, since people in the same place share exposures, services, and measurement error, and ignoring that clustering inflates your confidence in the results. Say what sits at level one and what sits at level two, report the intraclass correlation so a reader can see how much variation is between places, and be explicit about which coefficients are individual effects and which are contextual. Where power calculations are required, state the assumptions you used rather than only the answer, because a number with no assumptions attached cannot be checked. And when the analysis is spatial, treat the map as an argument: name the geographic unit, give the denominator behind any rate you shaded, say how the classes were cut, and label the legend so a reader is not left guessing whether darker means worse.

Keep results and discussion apart, then let the discussion do the real thinking. Report estimates with confidence intervals and point to the table; save mechanism, comparison, and implication for later. In the discussion, interpret the size of the effect in public health terms rather than statistical ones, since a small difference across a large population can matter more than a large difference in a rare group, and a statistically significant coefficient can be too small to justify a program. Compare your finding to published work through the Walden Library, where the licensed health services and epidemiology journals live and where the subject guides link straight to the surveillance portals. Then write limitations that name the analysis rather than the author. Cross-sectional timing, self-reported measures, coverage gaps in the sampling frame, the lag between collection and release, and the ecological fallacy when area-level data is used to reason about individuals are all specific and all scoreable. Regret about sample size is not.

SectionWhat goes in itWhat earns full rubric points
Question and rationaleThe public health problem, the specific research question, and why secondary data can answer it.A question narrow enough that the dataset can settle it, with the choice of data justified.
Data sourceThe survey or surveillance system, its sponsor, years, target population, and sampling design.Design features named as the documentation names them, with the weight variable identified.
VariablesOutcome, exposure, and covariates with their coding, categories, and any recoding you performed.Every variable traceable to the codebook, and covariates justified rather than listed.
Analytic sampleTotal records, each exclusion with its count, the final number, and the treatment of missing data.A chain a reader can add up, with the missing data decision stated and its consequence acknowledged.
AnalysisThe tests or models fitted, the software and version, and how the design was accounted for.A specification another analyst could rerun, with clustering and weighting handled explicitly.
ResultsFormatted tables, estimates with intervals, and prose pointing the reader through them.Reporting only, with no mechanism, no comparison, and no interpretation smuggled in.
Discussion and limitsMeaning, comparison with published findings, implications for practice, and what the design cannot show.Effect size read in public health terms, and limitations tied to the data rather than to the author.

Discussion posts in an analysis course

Threads here usually hand you a dataset, a surveillance report, or a finding and ask what you make of it. The post that scores brings a number and a caution. State what the data shows, give the estimate rather than a direction, then name the design feature that limits what anybody can conclude from it. One citation, ideally to the data documentation or to a study using the same source, does more than three general references. Walden expects a graded post or assignment during the opening week of the term, and an early entry into a quantitative thread is worth more than usual because classmates need something concrete to react to.

Replies are their own graded event and praise earns nothing. Interrogate the analysis instead. Ask whether the weights were applied and what changes if they were not. Point out that the comparison group differs on an obvious confounder and name it. Offer an alternative explanation the data cannot rule out, then say what evidence would separate the two. Walden's grading policy asks for participation that is substantive and timely and spread through the week rather than posted in one sitting, naming two to four posting days as a floor, and the university states plainly that requirements vary between courses and between weeks. Take the count and the closing time from your own classroom.

APA 7 for tables, figures, and statistics

Most of the APA risk in this course sits in the presentation. Tables need a number, an italicized title above, column headings that a reader can decode without the paragraph, and a note carrying the sample size and the model specification. Figures need a number, a title, and a note explaining the scale or the classification. Statistics have their own conventions worth learning once: italicize the symbols, keep decimal places consistent, report exact p values rather than only a threshold, and give confidence intervals alongside estimates because the interval says more than the asterisk. Never paste a software output window into the body of a paper and call it a table.

Citation-wise, the data itself must be cited. A public use dataset has a recommended citation in its documentation and it belongs in your reference list along with the codebook and any technical manual you relied on. Cite the software too, and the specific procedure if the course expects it. For the literature, search the Walden Library rather than an open engine, since the filters there let you restrict by design and population, and take formatting rulings from the Writing Center instead of copying them out of an older paper.

The mistakes that cost points in PUBH 8546

  • Analyzing a complex survey as though it were a simple random sample, which quietly manufactures significance.
  • An analytic sample that never gets counted, leaving the reader unable to tell who was excluded or why.
  • Missing data dropped silently, with no sentence acknowledging what that removal might have done.
  • Causal verbs applied to cross-sectional data, which is the fastest way to lose an interpretation row.
  • Software output pasted in as a screenshot instead of rebuilt as a formatted table.
  • Area-level findings used to make claims about individuals, without the ecological fallacy ever being named.
  • Maps with no denominator, no legend labels, and no statement of the geographic unit being shaded.

PUBH 8546 questions students actually ask

Which dataset should I choose for the analysis?

One that already contains your outcome, your main exposure, and the variables you plan to adjust for, in a geography that matches the question you want to ask. Check that before you fall in love with a topic, because the reverse order wastes weeks. Open the codebook first and confirm the variables exist in the year you intend to use, since large surveys rotate modules in and out and a measure present in one cycle can be missing from the next. Also confirm the file is public use and freely downloadable. Restricted files need an application and a data enclave, and no course assignment is worth that timeline.

How much statistical output belongs in the paper?

Formatted tables in the body, raw software output only if the assignment asks for it, and usually in an appendix when it does. A pasted screenshot of a results window is not an APA table, and it costs points in two rows at once, presentation and interpretation. Rebuild the numbers into a table with a number, a title, clear variable labels, and notes carrying the sample size and the model specification. Report effect estimates with confidence intervals rather than a lone significance marker, because the interval tells a reader about precision and the asterisk does not.

What is the real difference between results and discussion?

Results say what the data showed. Discussion says what it means. In the results section you report the estimate, the interval, and the test, and you point the reader to the table, with no speculation about mechanism and no comparison to other studies. In the discussion you interpret the size of the effect in public health terms, place it next to what other researchers have found, explain the disagreements, and say what should happen next. Students blur the two constantly, usually by explaining a finding the moment they report it. Splitting them cleanly makes both sections easier to write and easier to score.

Keep going

Online now